

Geospatial Intelligence
See Where Risk Lives. Act Where It Matters.
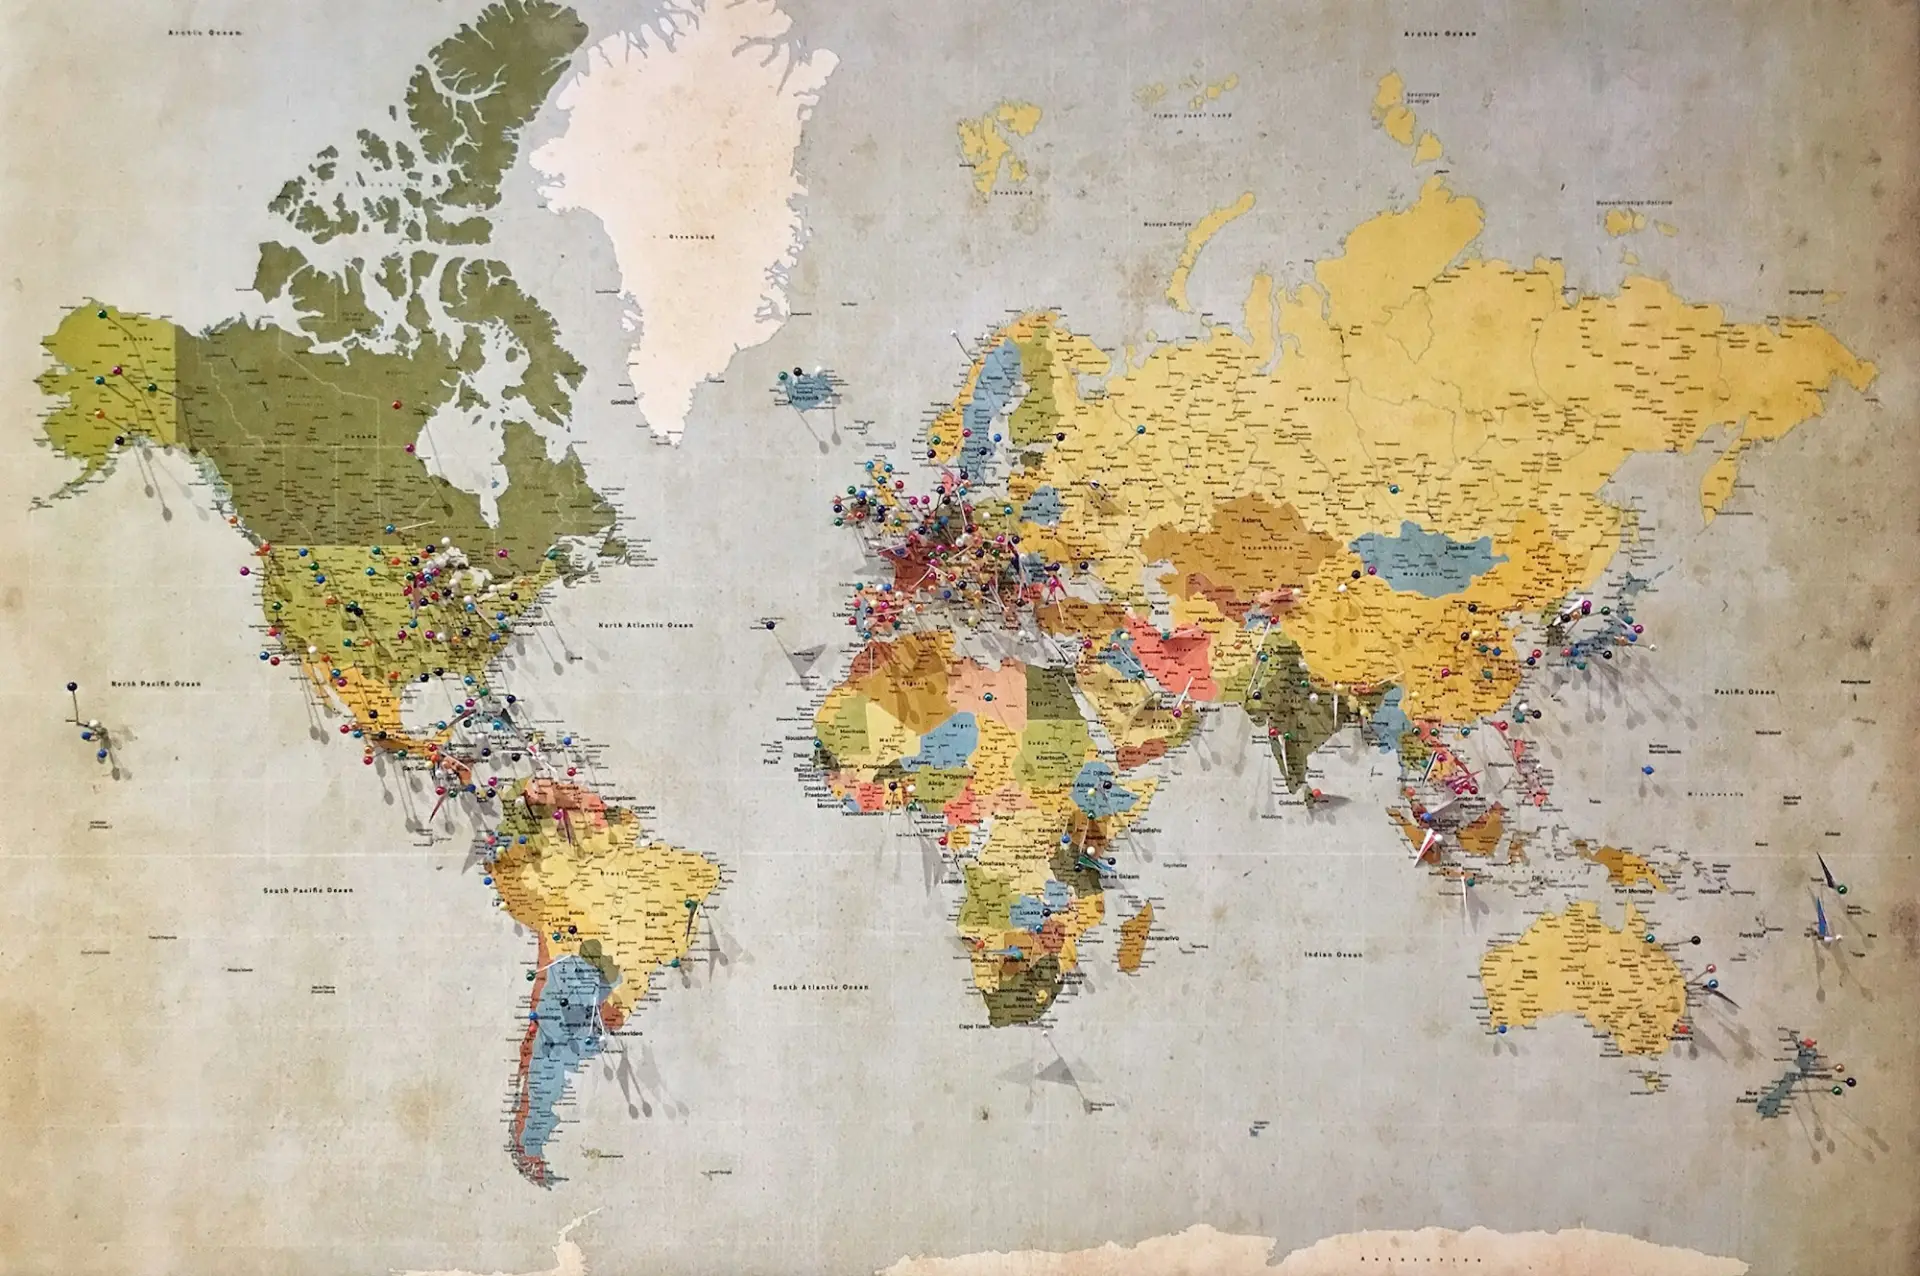
Transform complex geographic, environmental, and population data into actionable intelligence. Identify vulnerable communities, uncover disease hotspots, and direct interventions precisely where they can make the greatest difference.
Risk on the map
See the whole country, then every ward
Start from the national picture and follow the real administrative hierarchy down to the H3 grid, with population, facilities, intervention gaps and climate layered on the same map.
- Real boundaries for each country, down to ward or village
- Hotspots, gaps and facilities layered on one map
- Print-ready maps and GeoJSON for your own GIS
- <35
- 35–54
- 55–74
- 75+
Rank #3 of 14
Amber Ridge
- Children under 514.2%
- Travel time to facility97 min
- Net coverage65%
- Test positivity40.9%
Suggested public health investigation
Assess outreach options for remote settlements; consider community case management.
Illustrative explorer - fictional areas, simulated indicators and illustrative weighting.
What's included
Capabilities at a glance

Real administrative boundaries
Works with each country's own hierarchy: State → LGA → Ward, or State → District → Block → Village.
Map layers
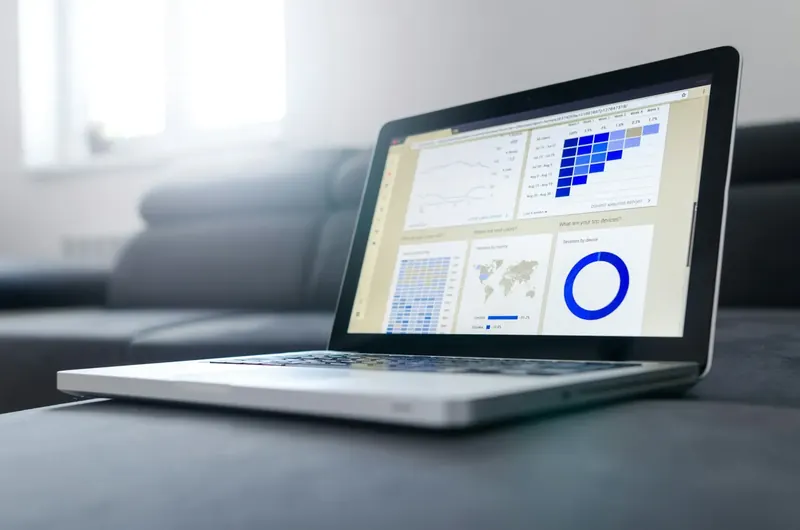
Hotspots, populations at risk, intervention gaps and health facilities, layered on one map.

Drill-down
Move from national level down to small local areas on a hexagonal H3 grid.
Spatial tools
Draw a polygon or radius to query an area, and measure distances directly on the map.

Environmental intelligence
Rainfall and climate data from NASA POWER, linked to disease risk.

Exports
Print-quality maps for briefings, and GeoJSON for your own GIS tools.
How it works
From data to decision
- 01
Locate
Start on the national map and see where risk is concentrated.
- 02
Drill down
Follow the administrative hierarchy, then the H3 grid, to the local area.
- 03
Understand
Overlay population, facilities, gaps and climate to see why risk is high there.
- 04
Share
Export a print-quality map or GeoJSON for planning and field teams.
Platform Intelligence
Works together with

Command Center & Situational Awareness
One Unified View. Every Critical Insight.
Learn more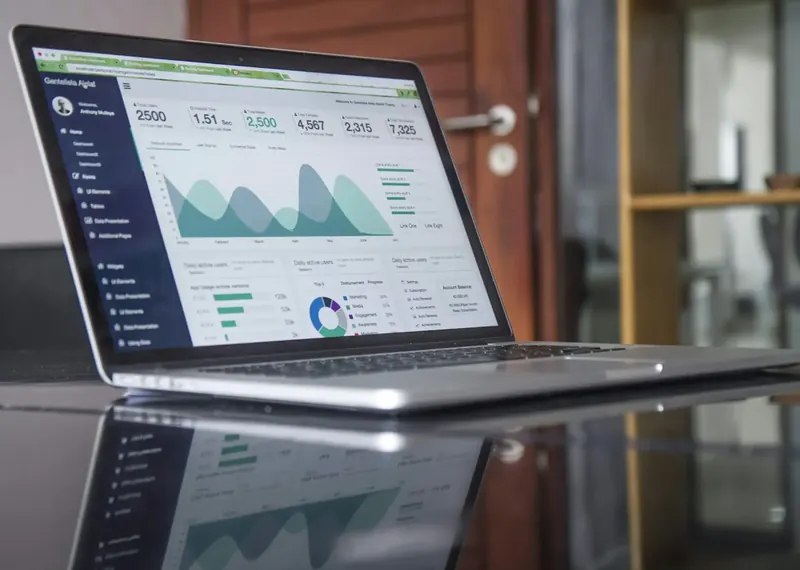
Predictive Analytics & Early Warning
Act before outbreaks happen.
Learn more
Operations, Planning & Optimisation
Turn insight into action.
Learn more
AI Copilot with Human Oversight
AI that advises while people decide.
Learn more
Data Integration, Governance & Reporting
Built on your systems and secured by design.
Learn more